92% of today’s S&P 500 companies have lost half their value since 1999
We measured the worst fall from a high for each of the 343 current S&P 500 members that traded in 1999. 317 of them fell 50% or more at least once. The index itself fell 55% at its worst, while the typical member fell 71%.
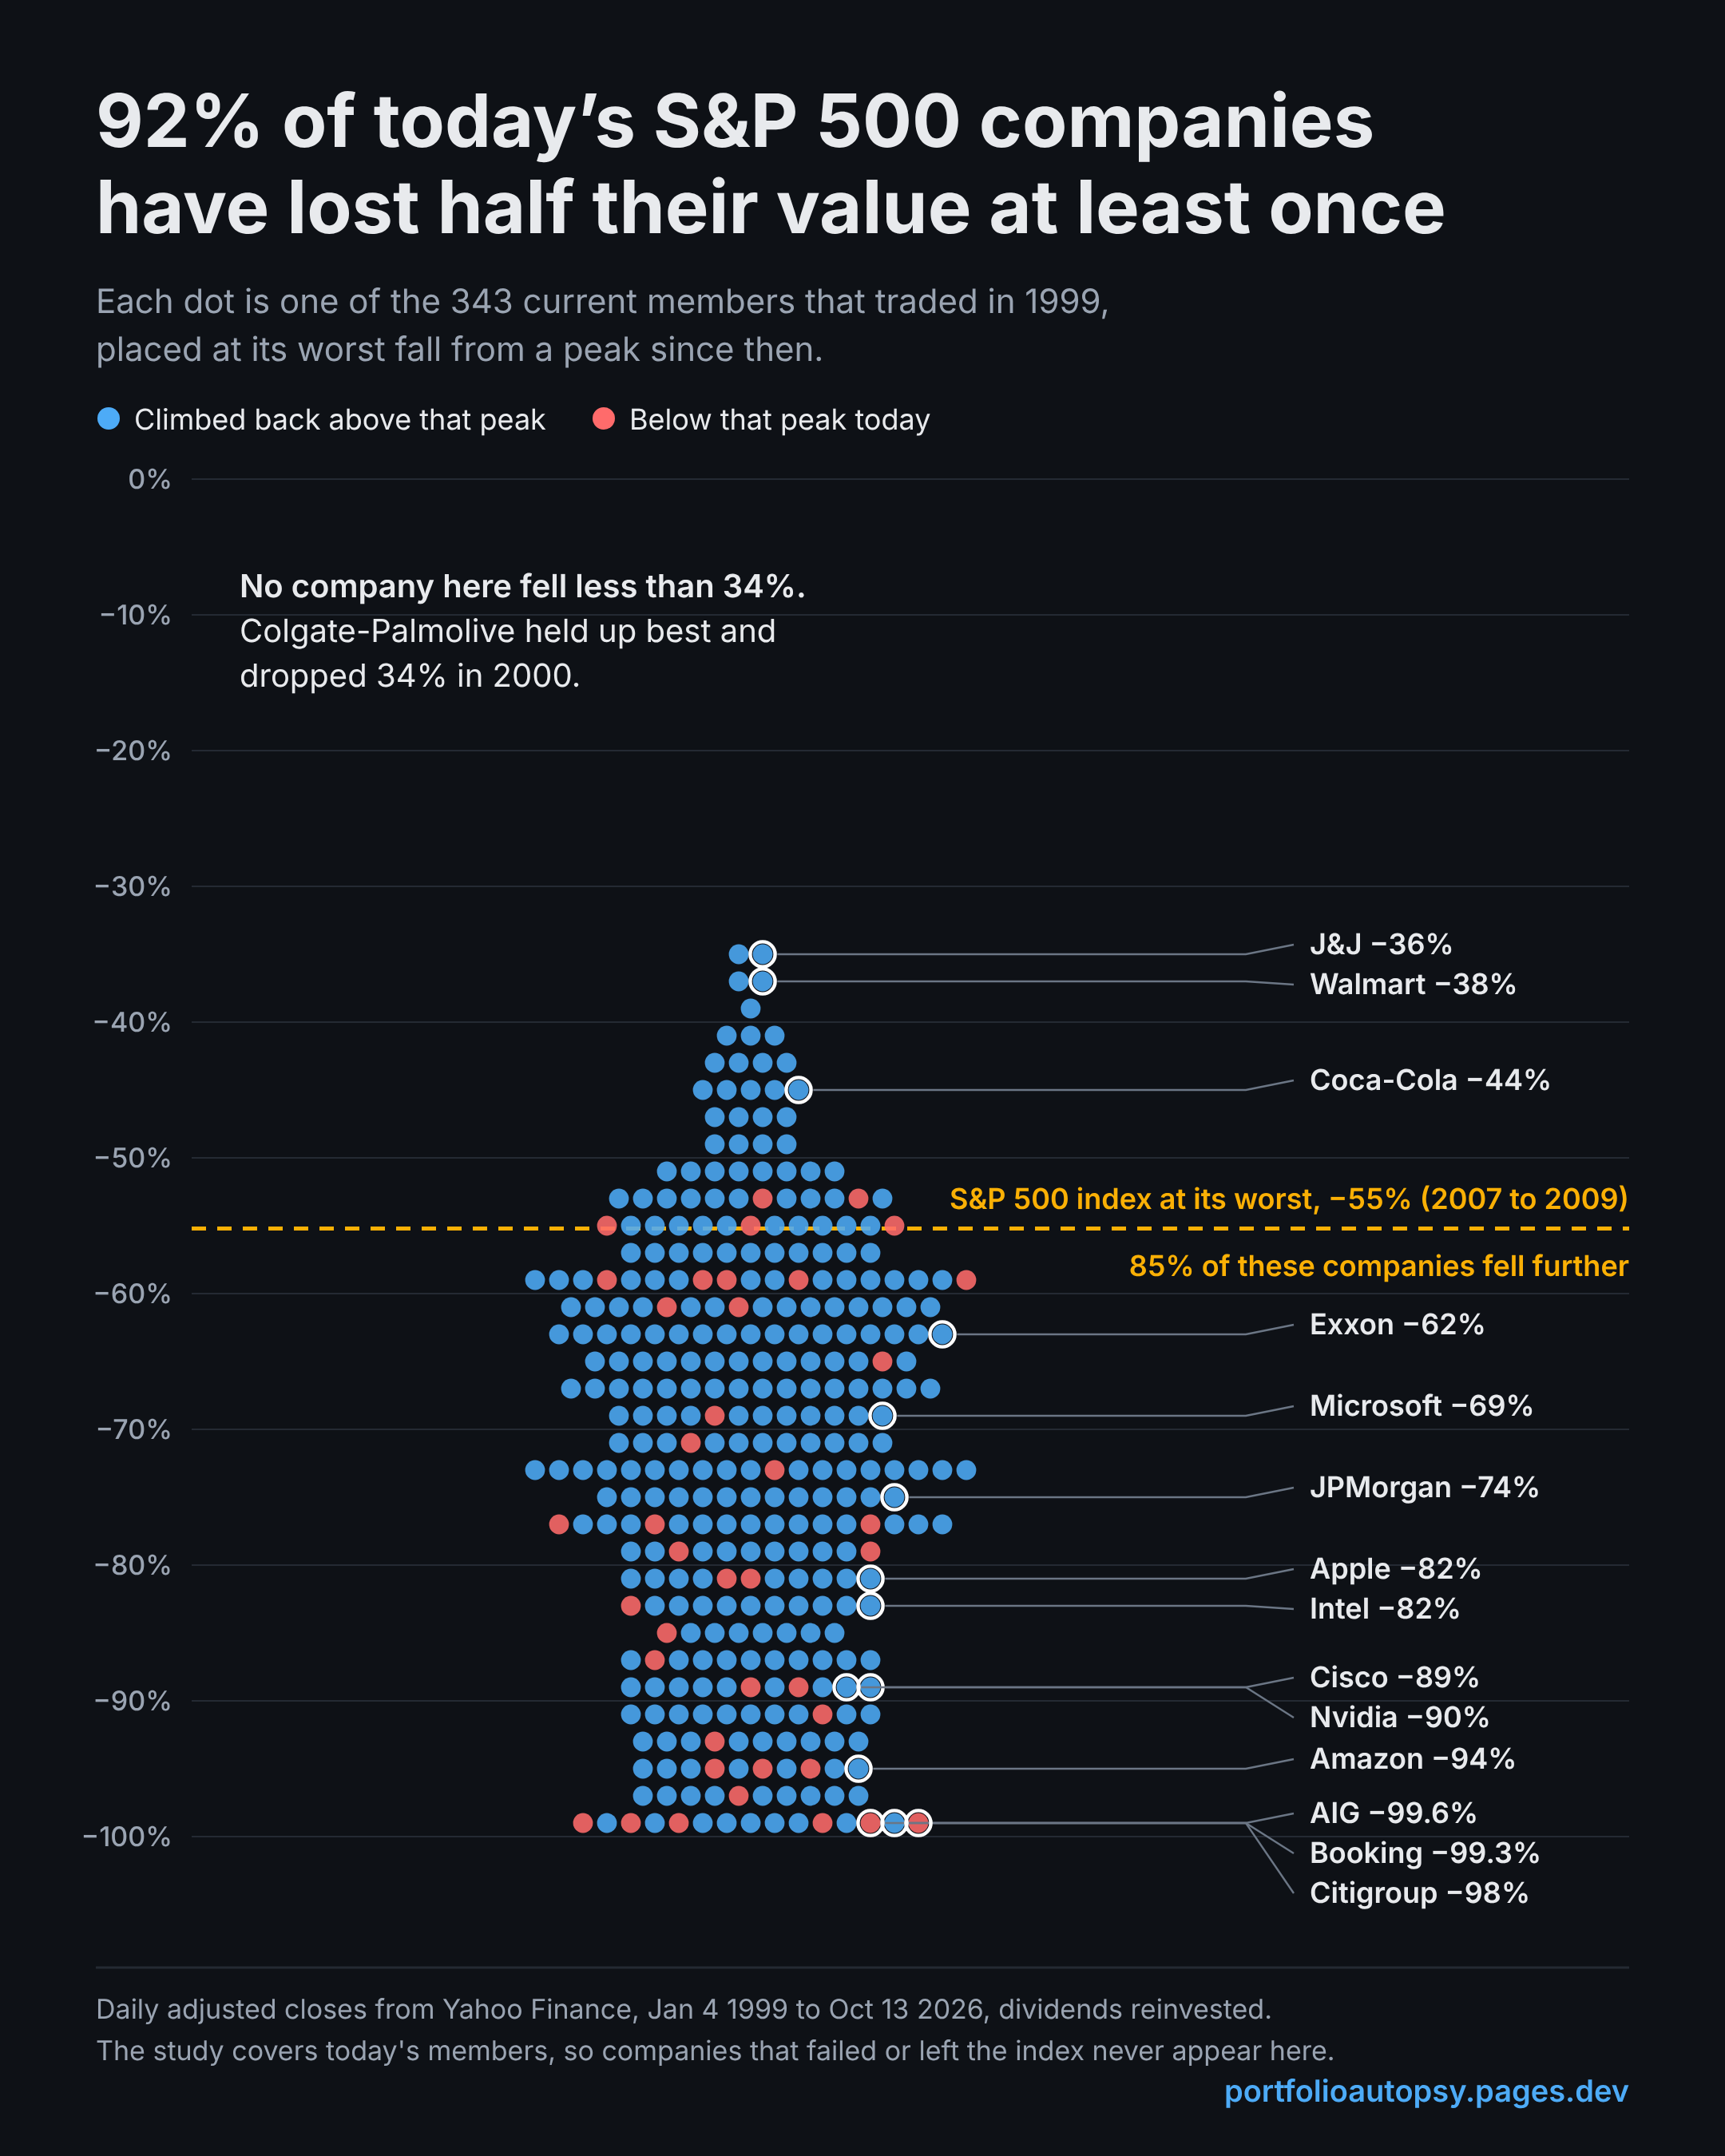
Losing half is normal for a single stock
A 50% fall feels like a disaster when it happens to you. Across the companies that make up today’s S&P 500, it was the rule. 291 of the 343 fell further than the index’s own 55% drop in the 2008 crisis. That gap is what diversification buys. The index held hundreds of these names at once, and their worst moments did not all land in the same month.
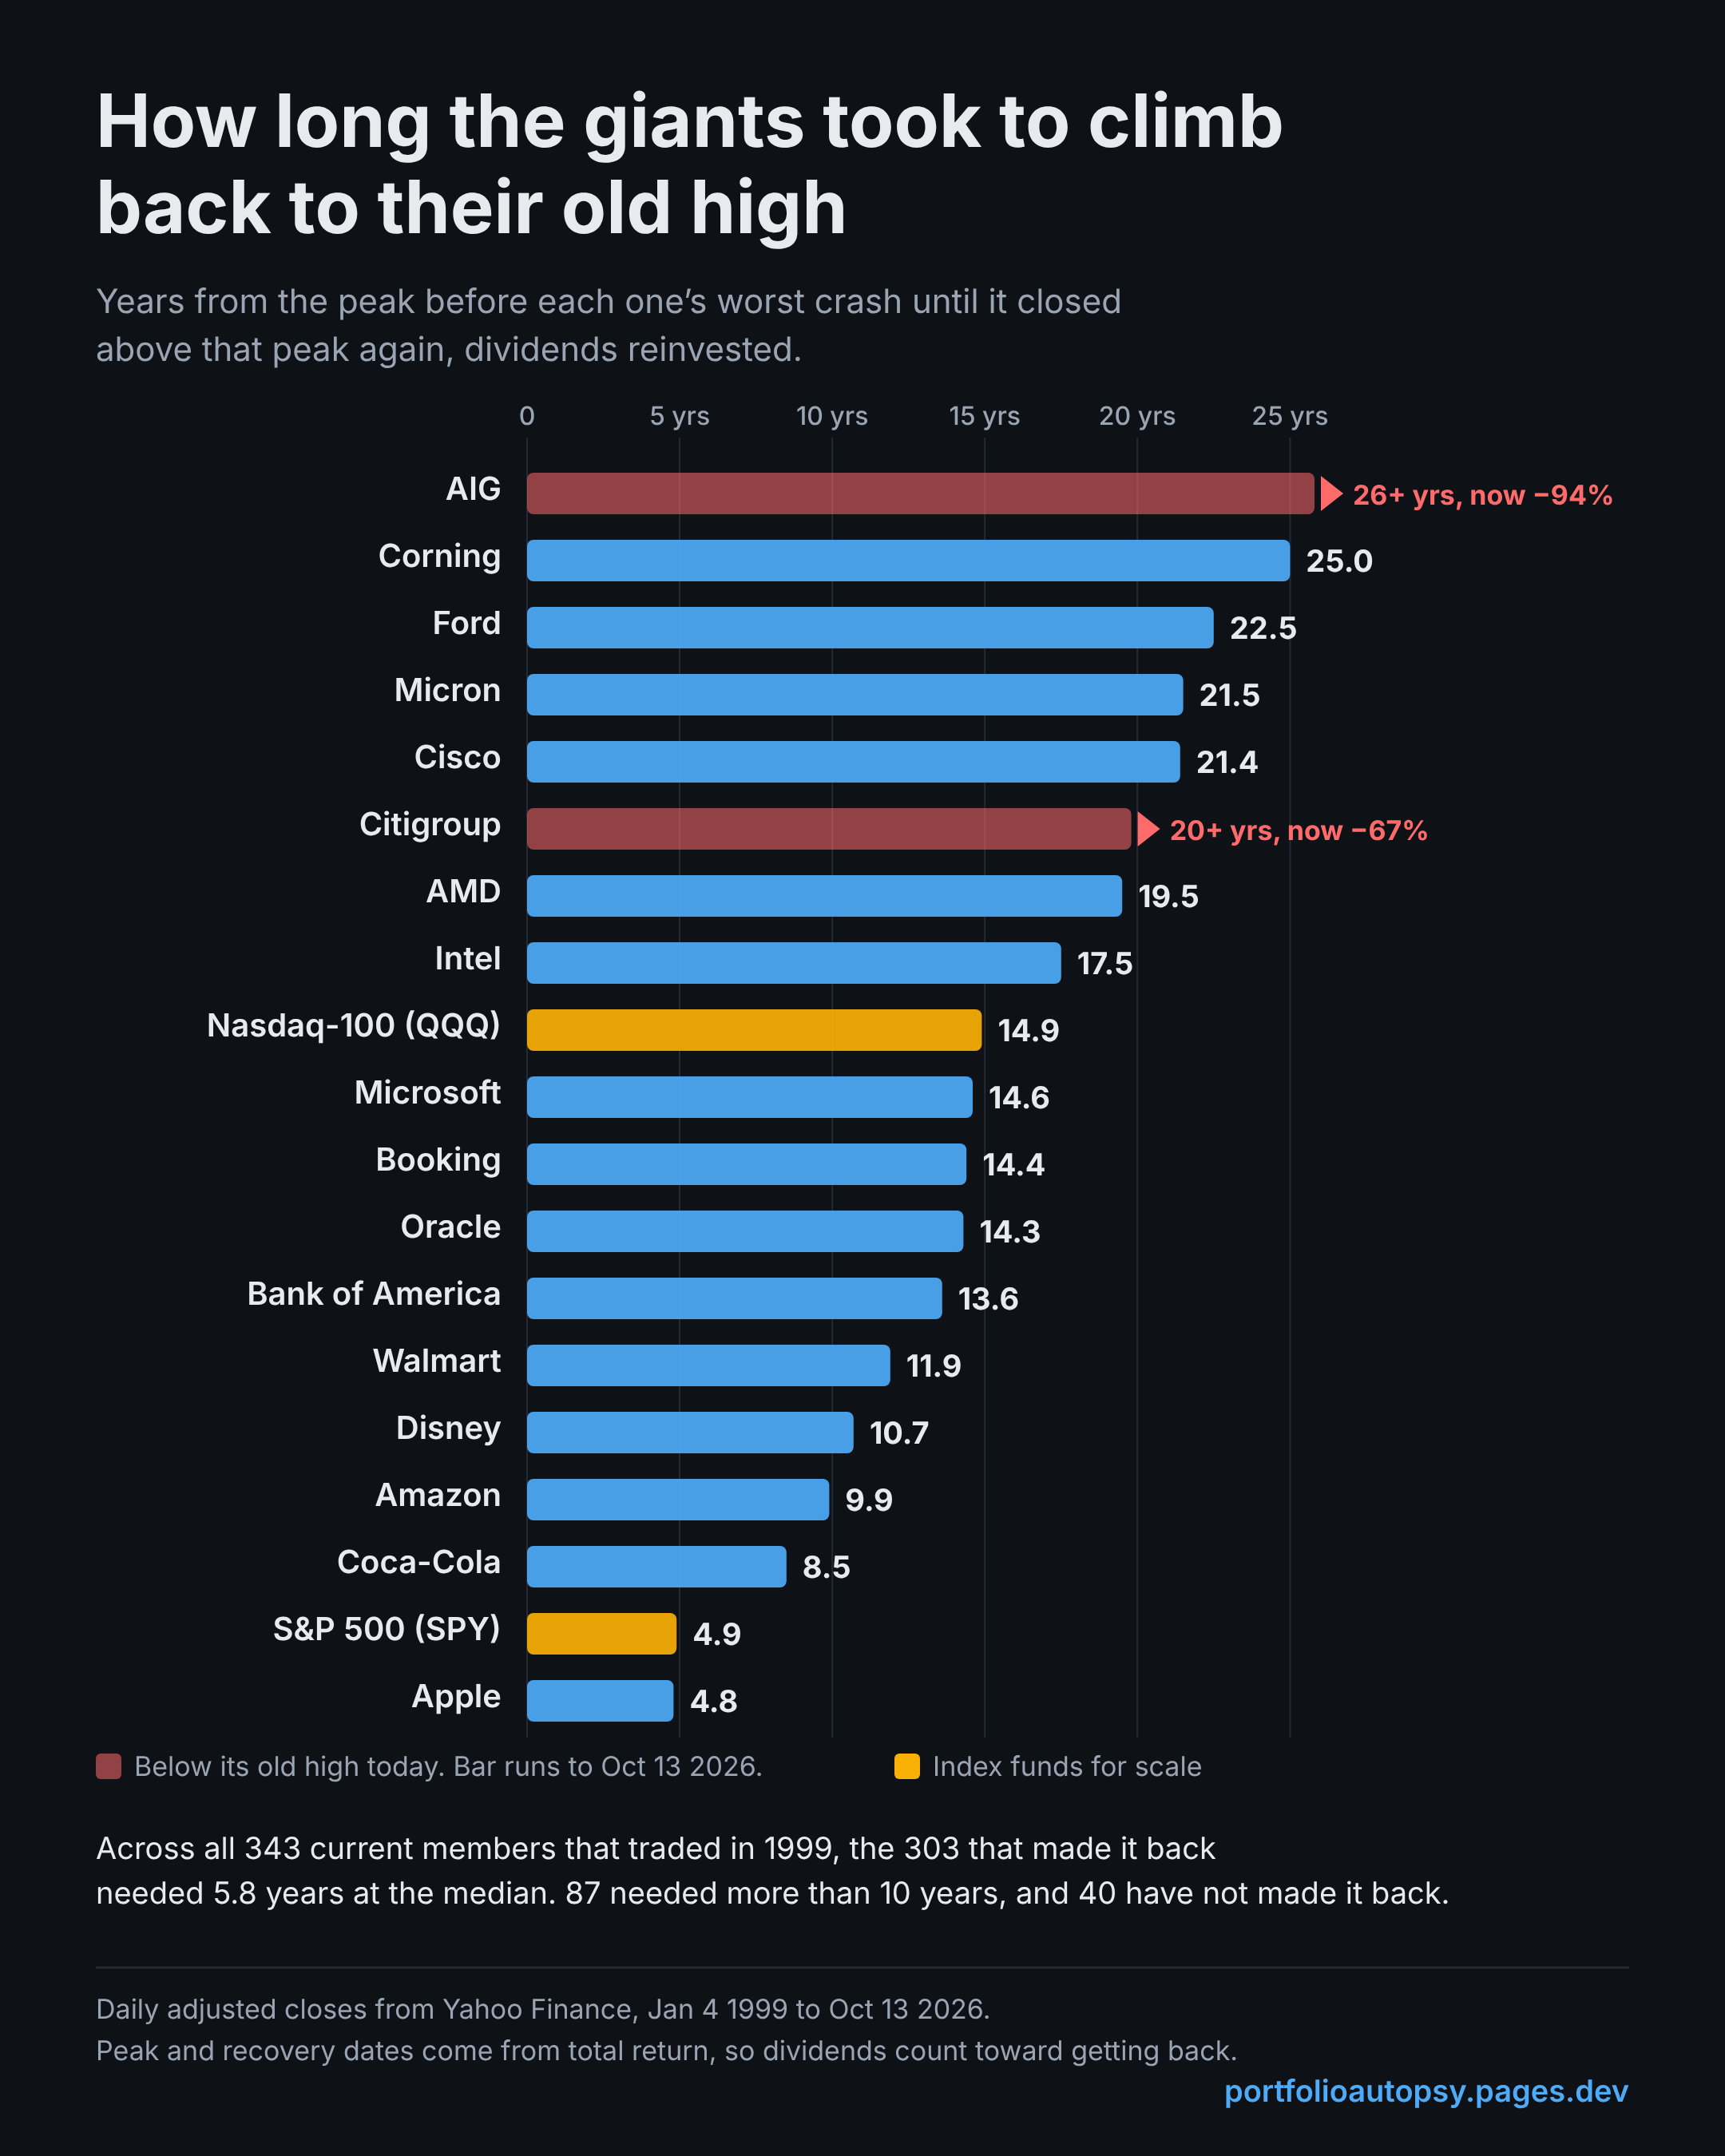
Getting back takes years
Of the 303 companies that climbed back above their pre-crash high, the median took 5.8 years. 87 needed more than a decade, and 40 have not made it back as of October 13, 2026. Dividends count toward the recovery here, because every figure uses total return.
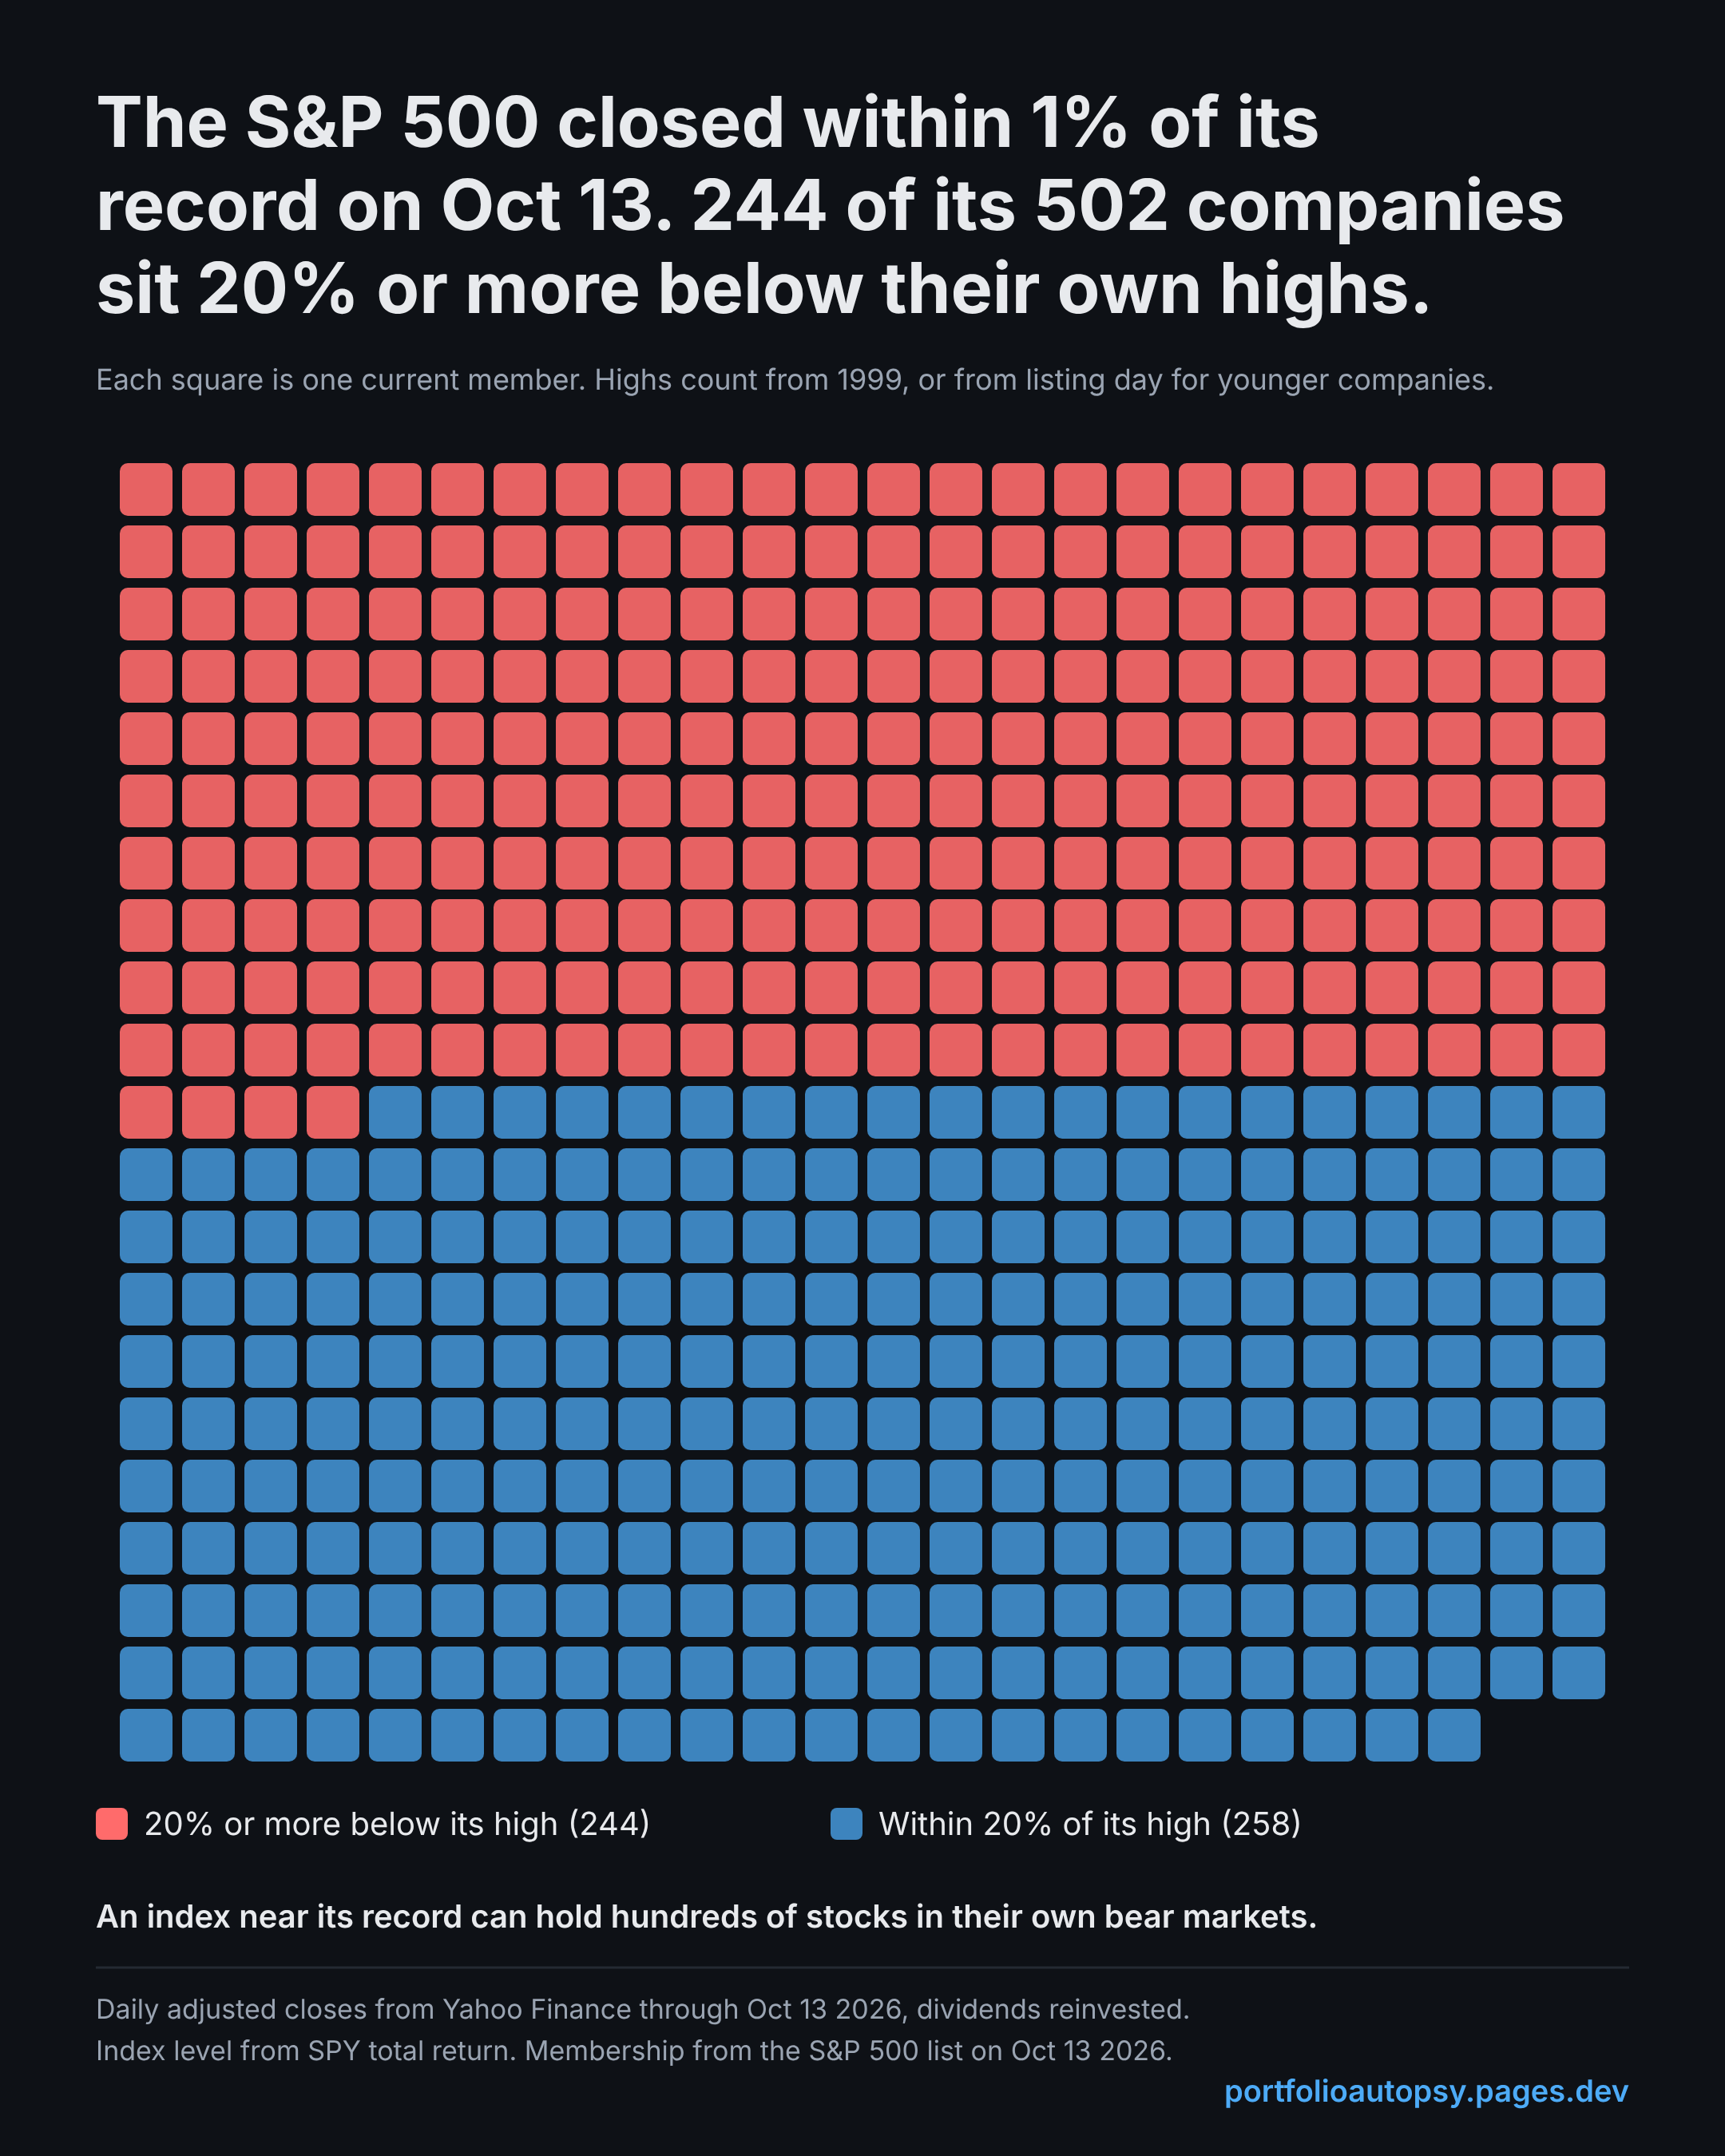
A record index can hide hundreds of bear markets
On October 13, 2026 the S&P 500 sat near its record, yet 244 of its 502 current members were 20% or more below their own highs. A strong index tells you little about the single stocks inside your account.
Famous names, worst moments
| Ticker | Company | Worst drop | Peak to low | Back to high |
|---|---|---|---|---|
| AIG | American International Group | −99.6% | Dec 2000 → Mar 2009 | not yet |
| C | Citigroup | −98.0% | Dec 2006 → Mar 2009 | not yet |
| CSCO | Cisco | −89.3% | Mar 2000 → Oct 2002 | 21.4 yrs |
| INTC | Intel | −82.2% | Aug 2000 → Oct 2002 | 17.5 yrs |
| AMZN | Amazon | −94.4% | Dec 1999 → Sep 2001 | 9.8 yrs |
| NVDA | Nvidia | −89.7% | Jan 2002 → Oct 2002 | 4.9 yrs |
| AAPL | Apple Inc. | −81.8% | Mar 2000 → Apr 2003 | 4.8 yrs |
| MSFT | Microsoft | −69.4% | Dec 1999 → Mar 2009 | 14.5 yrs |
| JPM | JPMorgan Chase | −74.0% | Mar 2000 → Oct 2002 | 6.8 yrs |
| KO | Coca-Cola Company (The) | −44.3% | May 1999 → Mar 2003 | 8.4 yrs |
| JNJ | Johnson & Johnson | −35.9% | Mar 2002 → Jul 2002 | 2.8 yrs |
| WMT | Walmart | −37.5% | Dec 1999 → Oct 2000 | 11.9 yrs |
PortfolioAutopsy runs the same math on your holdings, free and in your browser. You get the worst 12 months hiding in your mix, your odds of losing money by time horizon, and replays of 2008, 2020 and 2022.
Run a free risk checkLook up any tickerHow we measured it
Daily adjusted closes from Yahoo Finance, pulled with the yfinance Python library, from January 4, 1999 to October 13, 2026, with dividends reinvested. A drawdown is the fall from the highest close so far to a later low. Recovery means the first close above that old high. The study covers today’s members, so companies that failed or left the index never appear here, which makes the real picture worse than these numbers. The full list of 343 companies is free to reuse with a link back. Download the CSV.
Historical facts, not a forecast and not investment advice.