Press kit
Everything on this page may be quoted or reused. Screenshots open at full size when clicked.
One sentence
PortfolioAutopsy is a free tool that shows self-directed investors how far their exact mix of holdings has fallen in past markets, and which changes they control would have softened it.
One paragraph
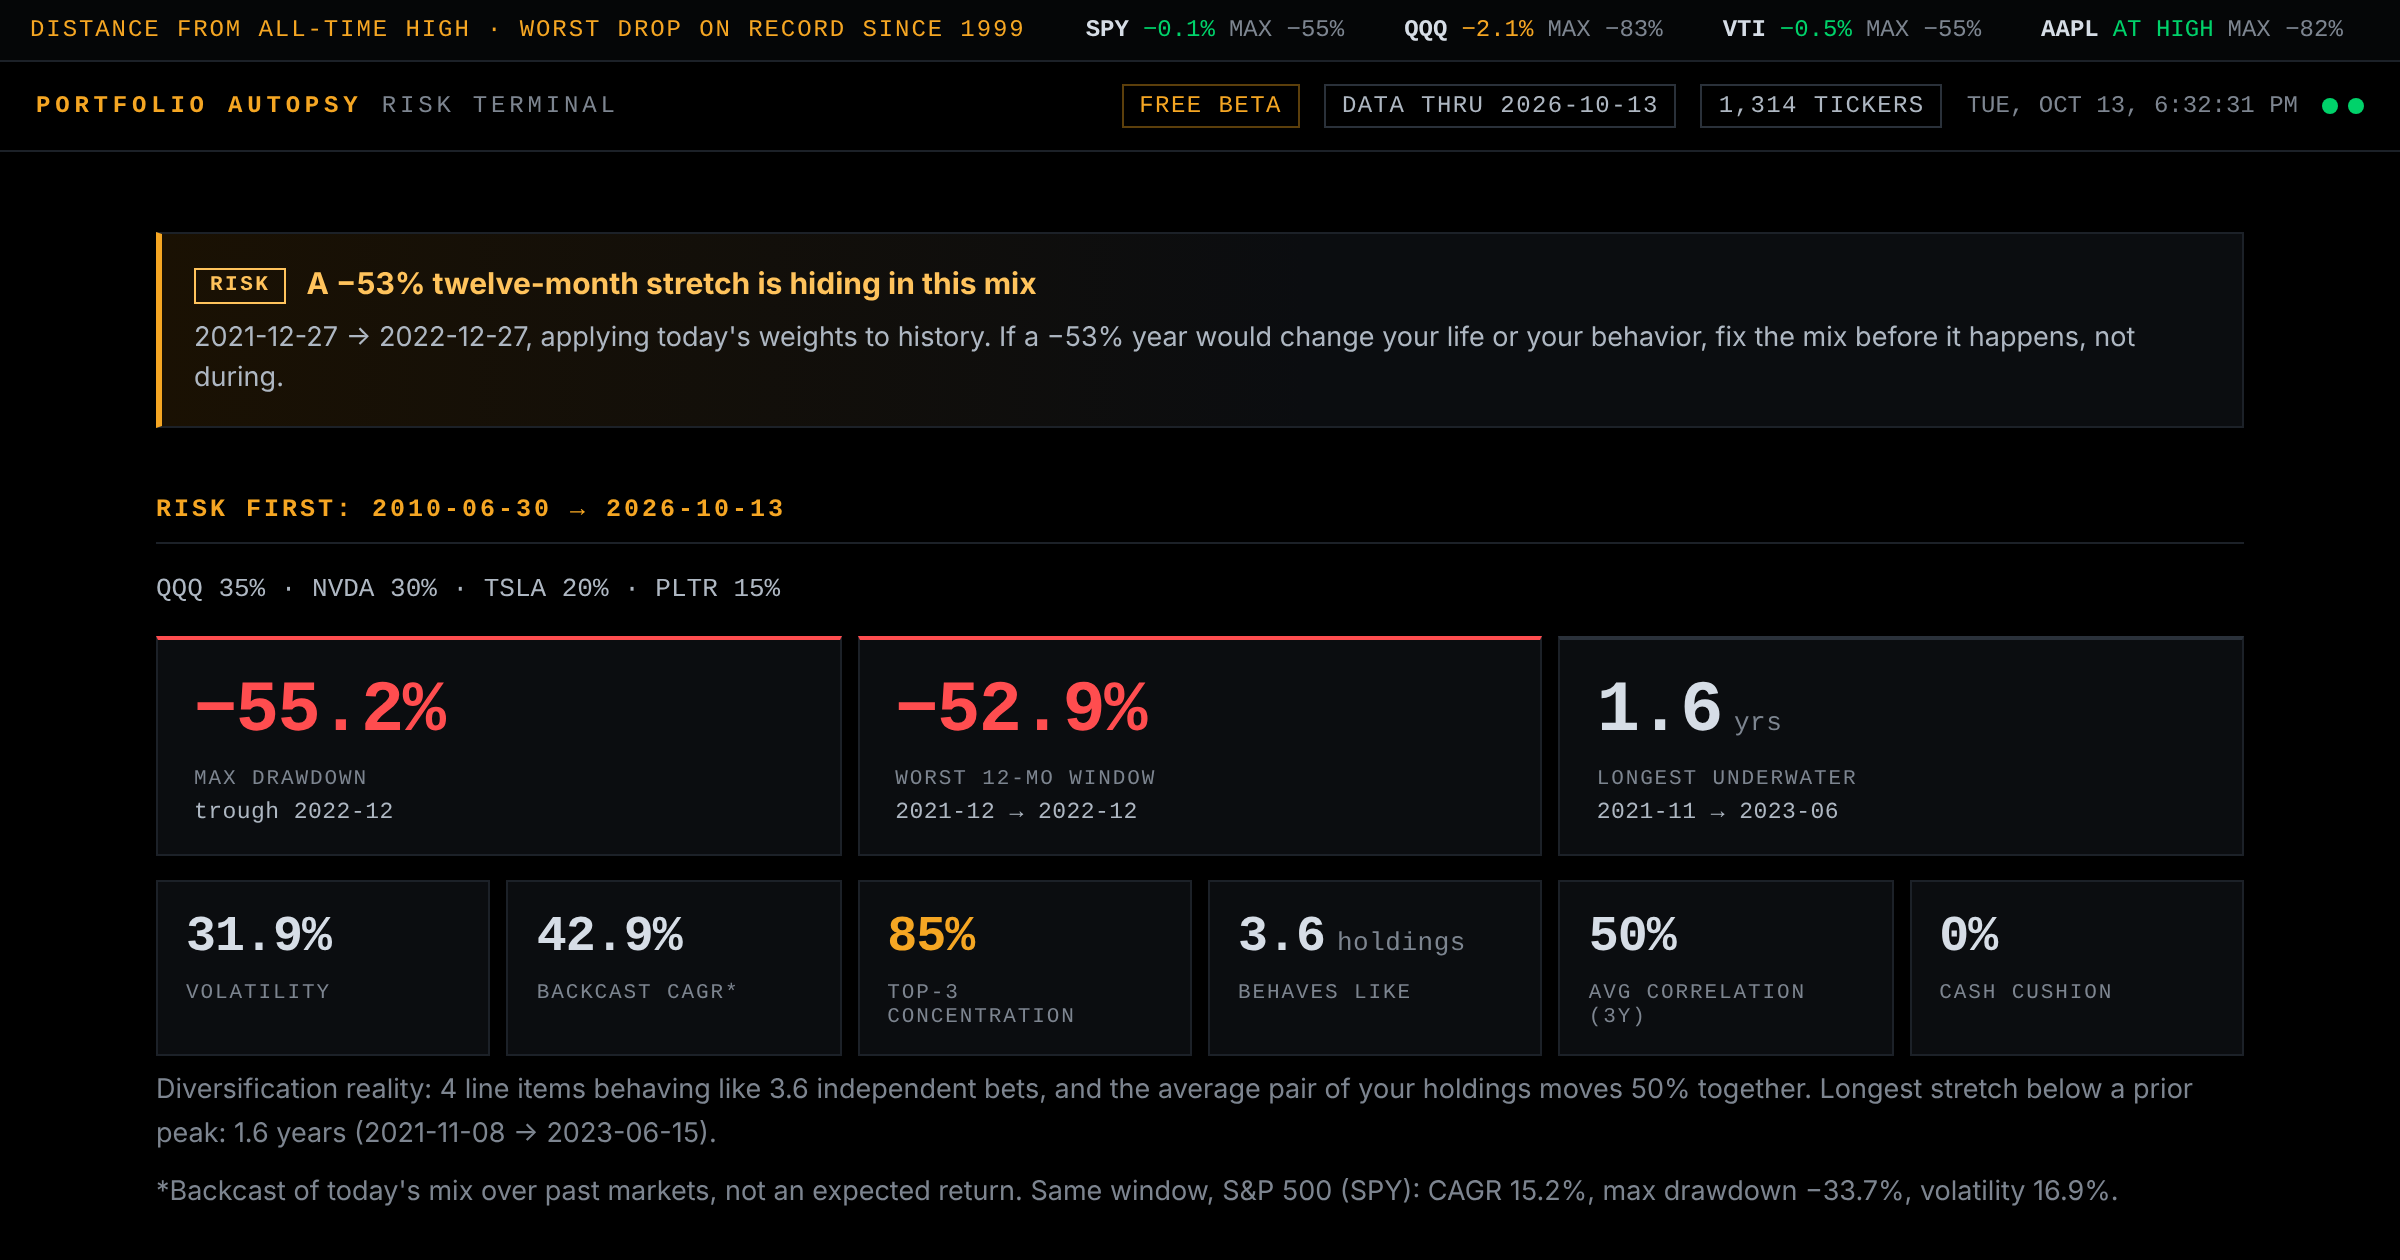
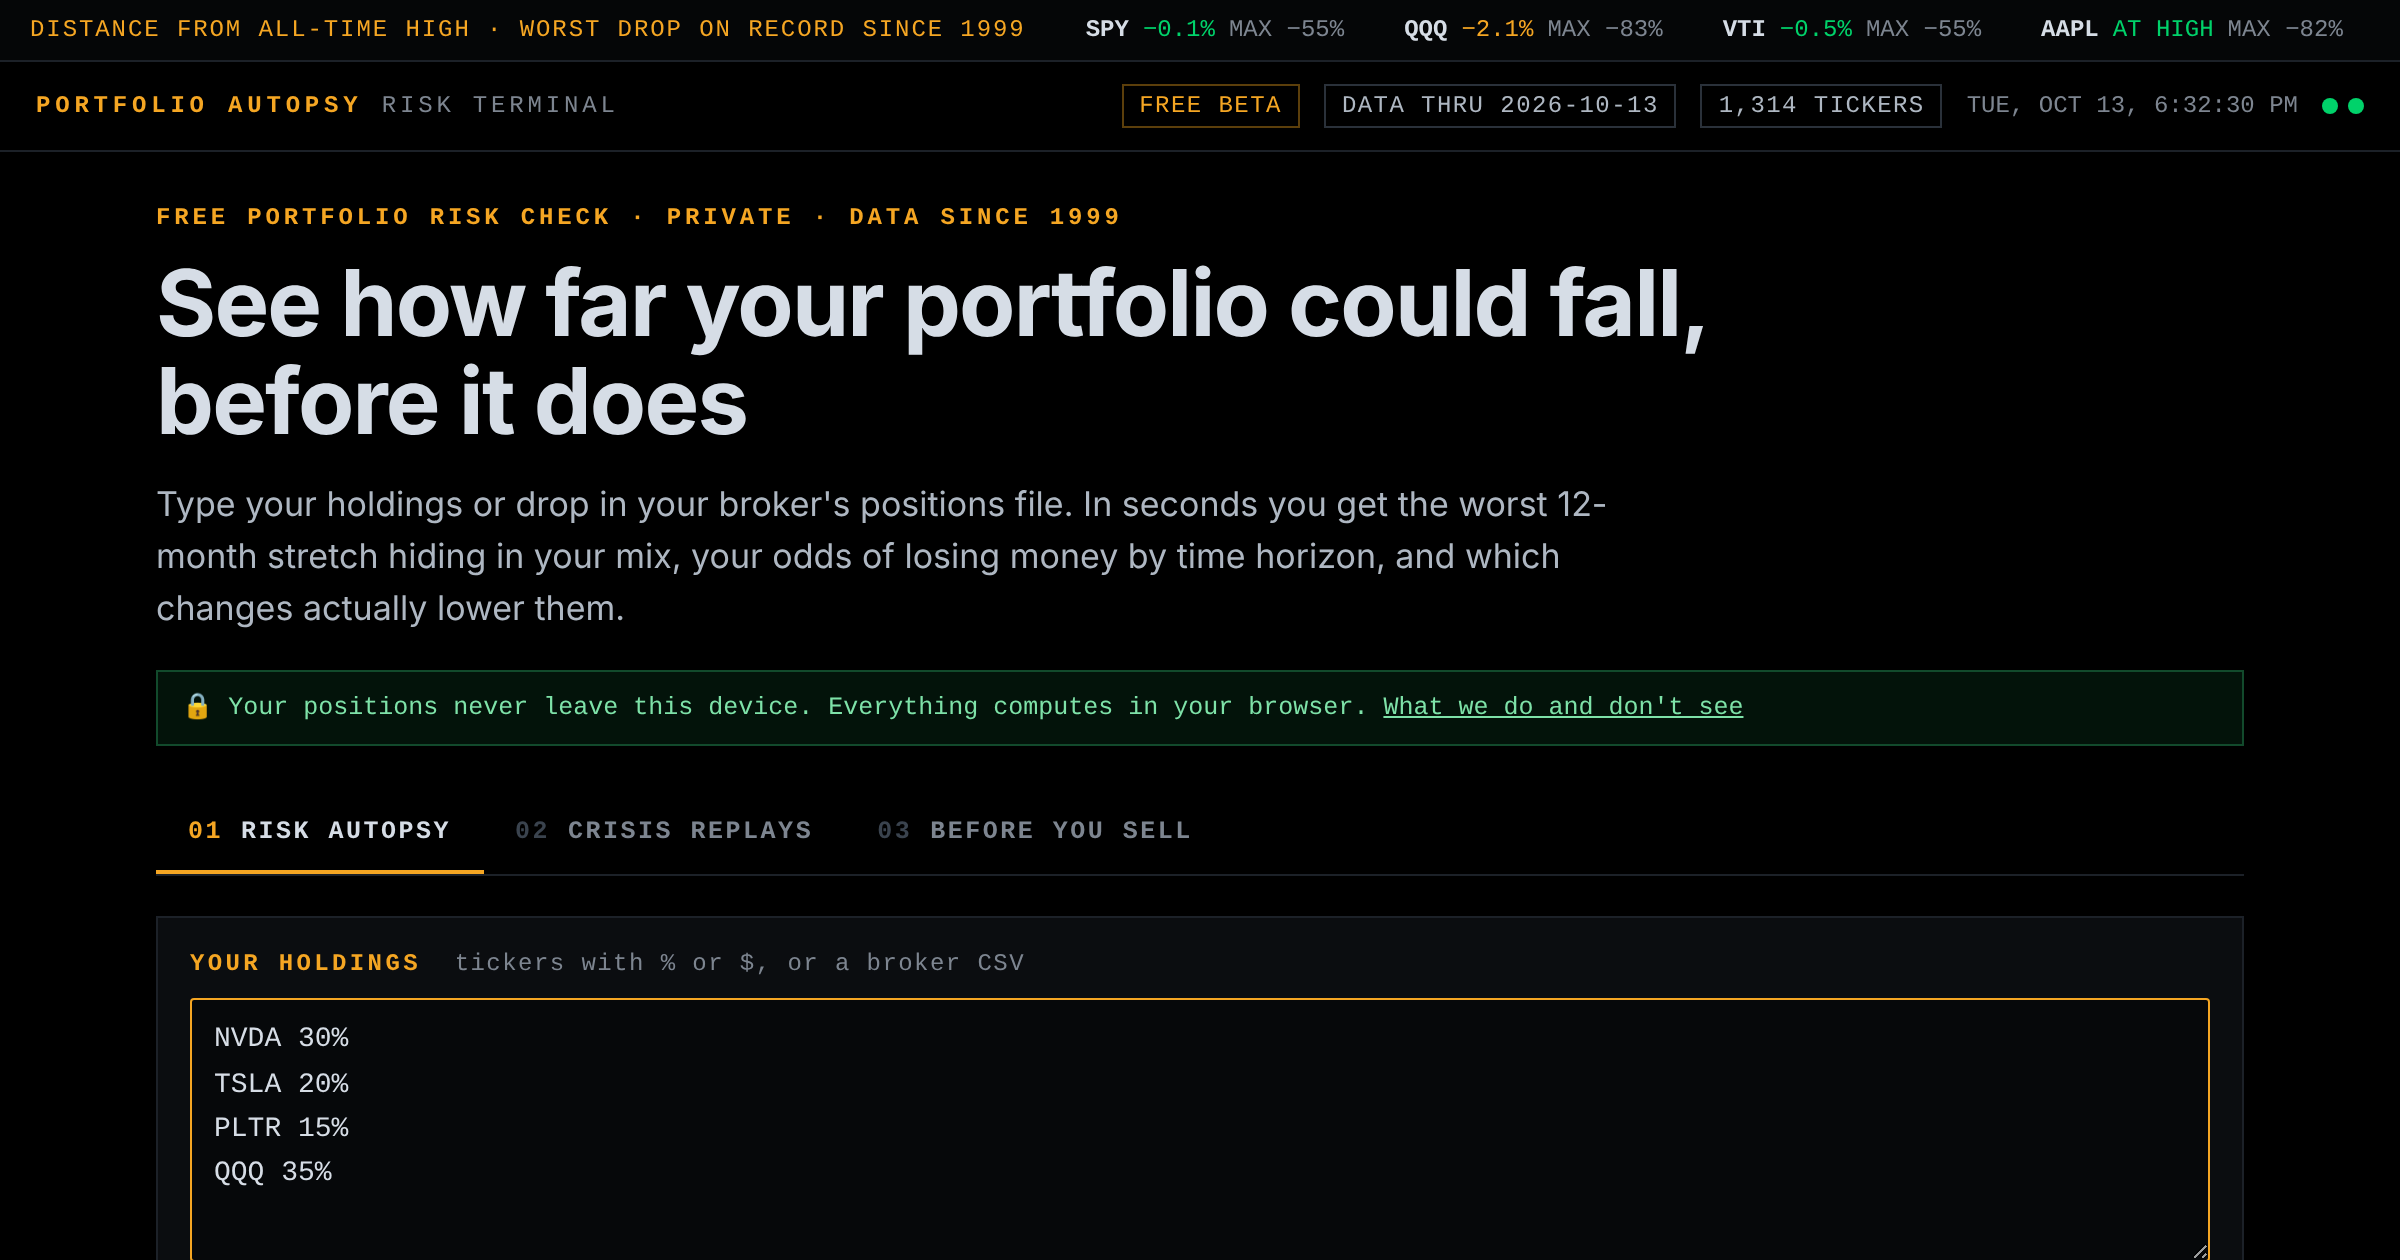
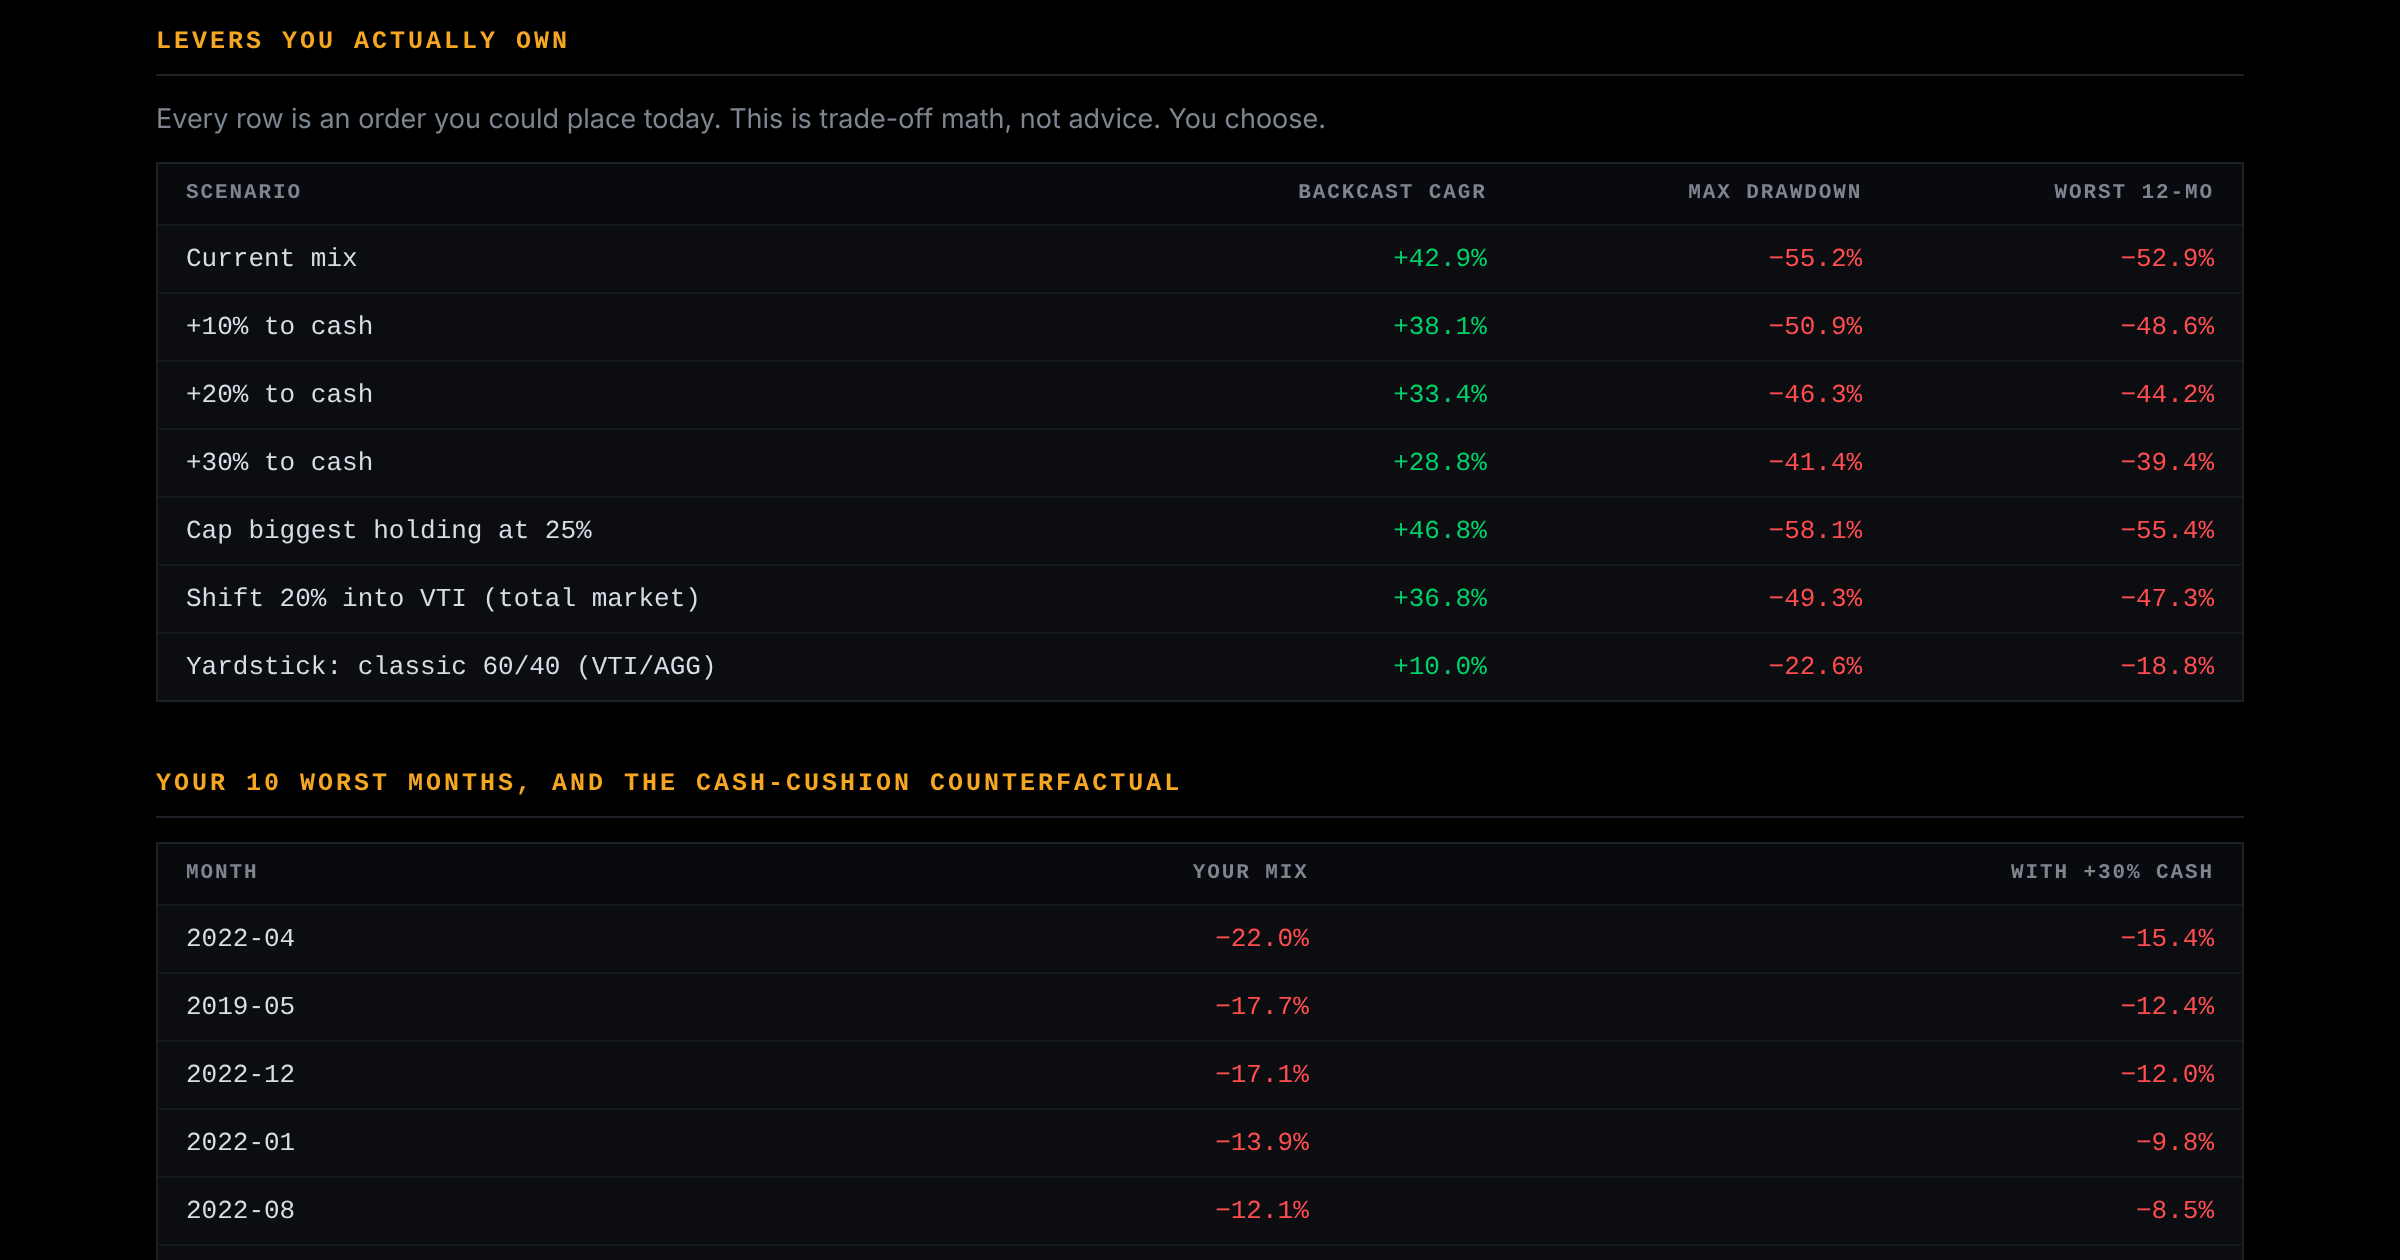
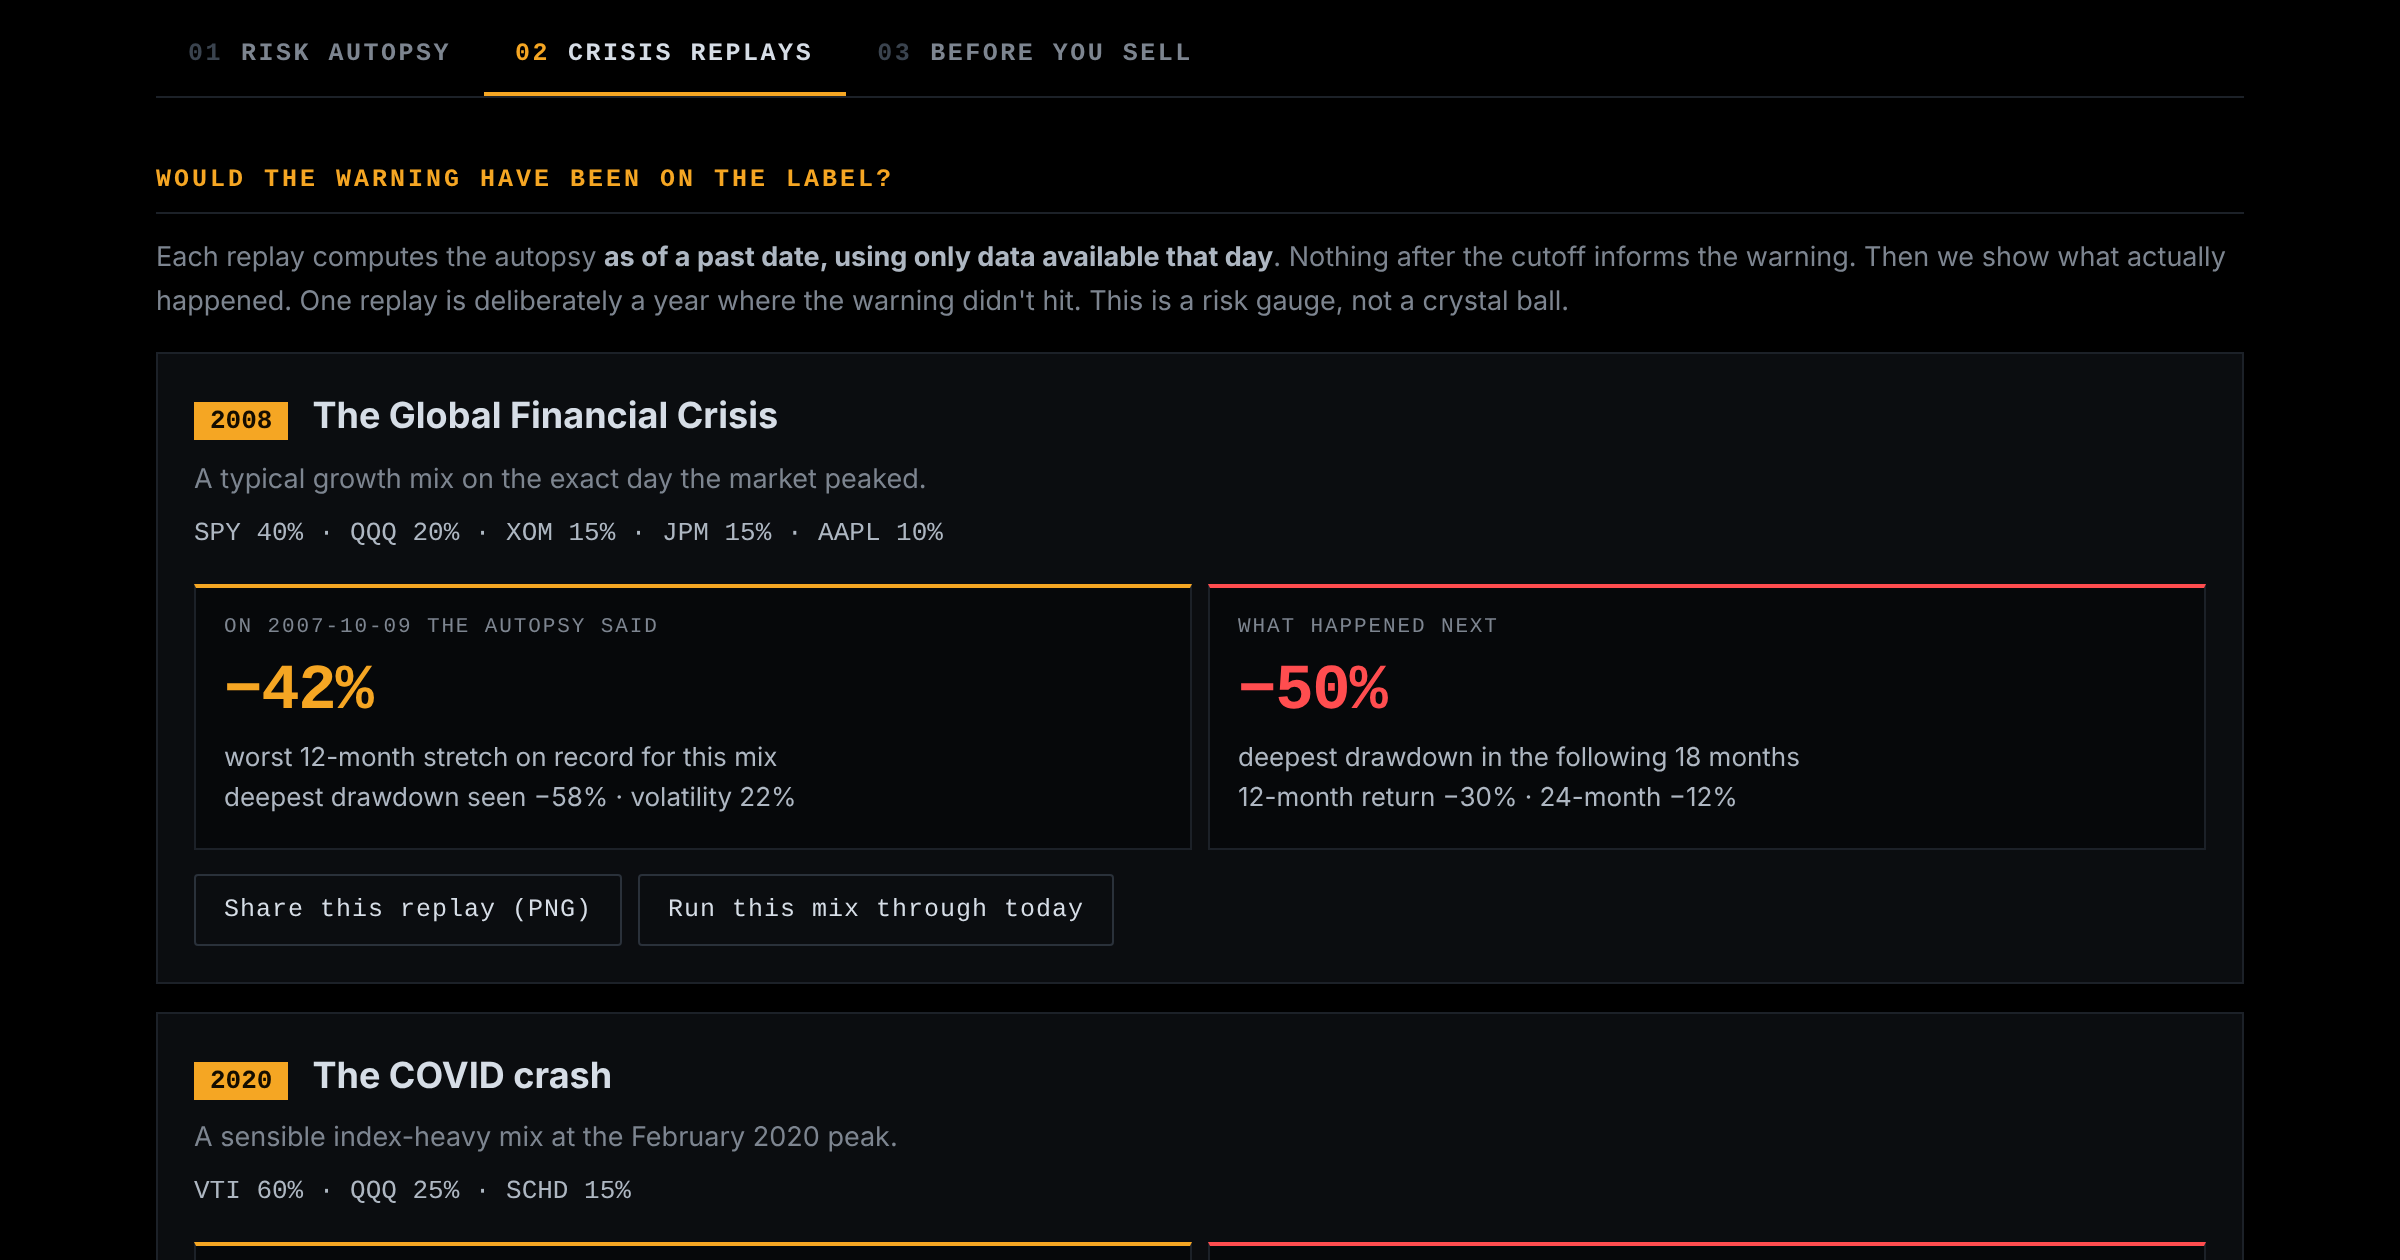
You type your holdings (or upload a Schwab, Fidelity or Vanguard positions file) and PortfolioAutopsy applies today's weights to daily market data back to 1999. It reports the worst 12-month stretch for that mix, the deepest drawdown, the odds of losing money over one, three and five years, and how much adding cash or capping the largest position would have changed those numbers. A Crisis Replays tab reruns the analysis as of the day before 2008, 2020 and 2022, using only data available that day, and shows what happened next. A Before You Sell tab asks for your reason before a sale and starts a 24-hour timer if fear is the only one. The math runs in the browser, so a user's dollar amounts never leave their device. An Edge Lab tab publishes four paper-trading accounts and their pre-registered races, the same for every visitor.
Facts
- Free, no account, no sign-up required.
- Covers 1,314 tickers as of October 13, 2026, including the S&P 500 and 400, about 250 ETFs, and the common Fidelity, Vanguard, Schwab and American Funds mutual funds.
- Daily adjusted price history back to January 1999 where it exists.
- Public beta since August 13, 2026. Version 3 launched October 13, 2026.
- Built by Cooper Brown, a junior at the University of Southern California studying Health and the Human Sciences with a minor in Business Finance.
- The build passes 37 automated math checks and 31 browser tests, and the results appear inside the app under "Receipts."
- Not investment advice. No account connections, no trading.
Why it exists
Brokerage apps show what a portfolio returned. They rarely show how far it fell on the way, or how long it stayed down. Morningstar's "Mind the Gap" study finds investors trail their own funds by roughly 1.2 percentage points a year because they sell during drops and buy back late. PortfolioAutopsy puts the drawdown on the label before the drop, and puts a pause between a scared investor and the sell button during it.
Screenshots
Contact
Cooper Brown, coopermb@usc.edu. Site: portfolioautopsy.pages.dev. A demo report loads at portfolioautopsy.pages.dev/?demo=1.